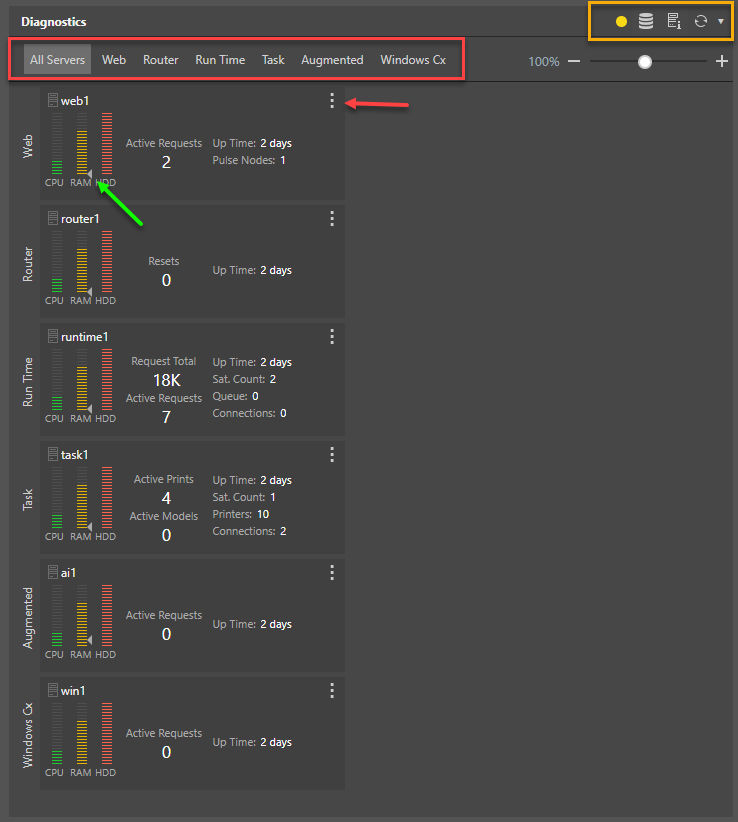
The Diagnostics dashboard interface presents all the system's servers and their usage.
Quick Buttons
The quick buttons on the dashboard (orange box above) offer access to the following functions:
- The dashboard refresh button to refresh the data from the diagnostics data.
- From the refresh drop down, select the required refresh schedule. By default the schedule is set to 'Every 30 Seconds'. If you don't want a scheduled refresh, select 'None'.
- The System Info button opens a dialog with special JSON text that summarizes the entire Pyramid cluster. Use this to add support tickets to Pyramid's help desk easily.
- The Database Repo button open a dialog showing key information about the database repository used for the Pyramid instance.
- The next 3 icons are "warning lights" that will only appear under certain circumstances. They will only light up if you have certain settings on that can degrade system performance. Hover over the lights to see the issues
- Red: certain logging settings have been enabled and should be turned off. These have a major impact on performance.
- Yellow: certain settings have been enabled and are recommended to be turned off
- Yellow "T": the task engine has been paused and no new tasks will be processed.
Server Panels
The server panels allow you to get a mini-diagnostic per service in the cluster. To simplify the UI, you can hide and show different server combinations using the filter buttons (red box).
Different things are shown for each service.
Resource Usage
Each server panel displays resource usage of the host machine, measured from 0% - 100%:
- CPU: displays green if CPU usage is 85% or less, yellow if it's 86% - 90%, and red if it's 91% or above.
- Memory: displays green if memory usage is 85% or less, yellow if it's 86% - 90%, and red if it's 91% or above.
- Disk: displays green if hard disk drive usage is 60% or less, yellow if it's 61% - 80%, and red if it's 81% or above.
A small indicator appears on the memory graph (green arrow) showing the current service's current memory as a percentage of the amount available.
System Resource Warnings
The system can auto email / SMS enterprise admins if and when any resource levels are determined to be critically high (red). This option to enable this can be found under networking and requires email and/or phone messaging to be enabled.
Indicators
Depending on the service type, high level indicators are provided
- Active Models: the number of data models currently being processed or scheduled to be processed.
- Active Prints: the number of print jobs currently being processed or scheduled to be processed.
- Connections: the number of active connections against the repository database.
- Printers: the number of printers currently connected to the task engine server.
- Pulse Nodes: number of pulse nodes.
- Queue: the number of requests that are waiting to be processed.
- Requests: the number of current active requests.
- Request Total: the total number of requests that have been sent to the Run Time server during the current up time.
- Resets: number of times the server has been reset.
- Sat Count: number of satellite servers running.
- Up Time: the time since the server was last reset.
Server Actions
Click the server panel's context menu (red arrow) to access several actions for each node:
- Rename the server panel; this is the description at the top of the panel (green highlight).
- Restart the server: this will recycle the service on the host machine. BEWARE: This may render the cluster inoperable until it is restored.
- Reload configuration; this will instruct the service to reload its stored configuration from the database to flush / refresh its settings. BEWARE: this may render the cluster inoperable until its restored.
- Run Garbage Collector: free up memory by removing unused items from the given service. The garbage collector can also be run for all services from Server Instances, or automated for all services from System Limits.
- Set Memory Limit: this will provide a dialog allowing admins to change the upper memory limit (measures in Mega Bytes) for the selected service. Click here for more details.